
News of international conflicts dominated the end of the quarter. The disruption of petroleum supply chains in West Asia has led to sudden price increases at the gas pump, the grocery store, and on the front page of home heating bills. Given these recent developments, investors may believe that the entirety of Q1 consisted exclusively of market downturns.
Read our Markets & Factors report below. You will see this was objectively not the case.
The Big Picture
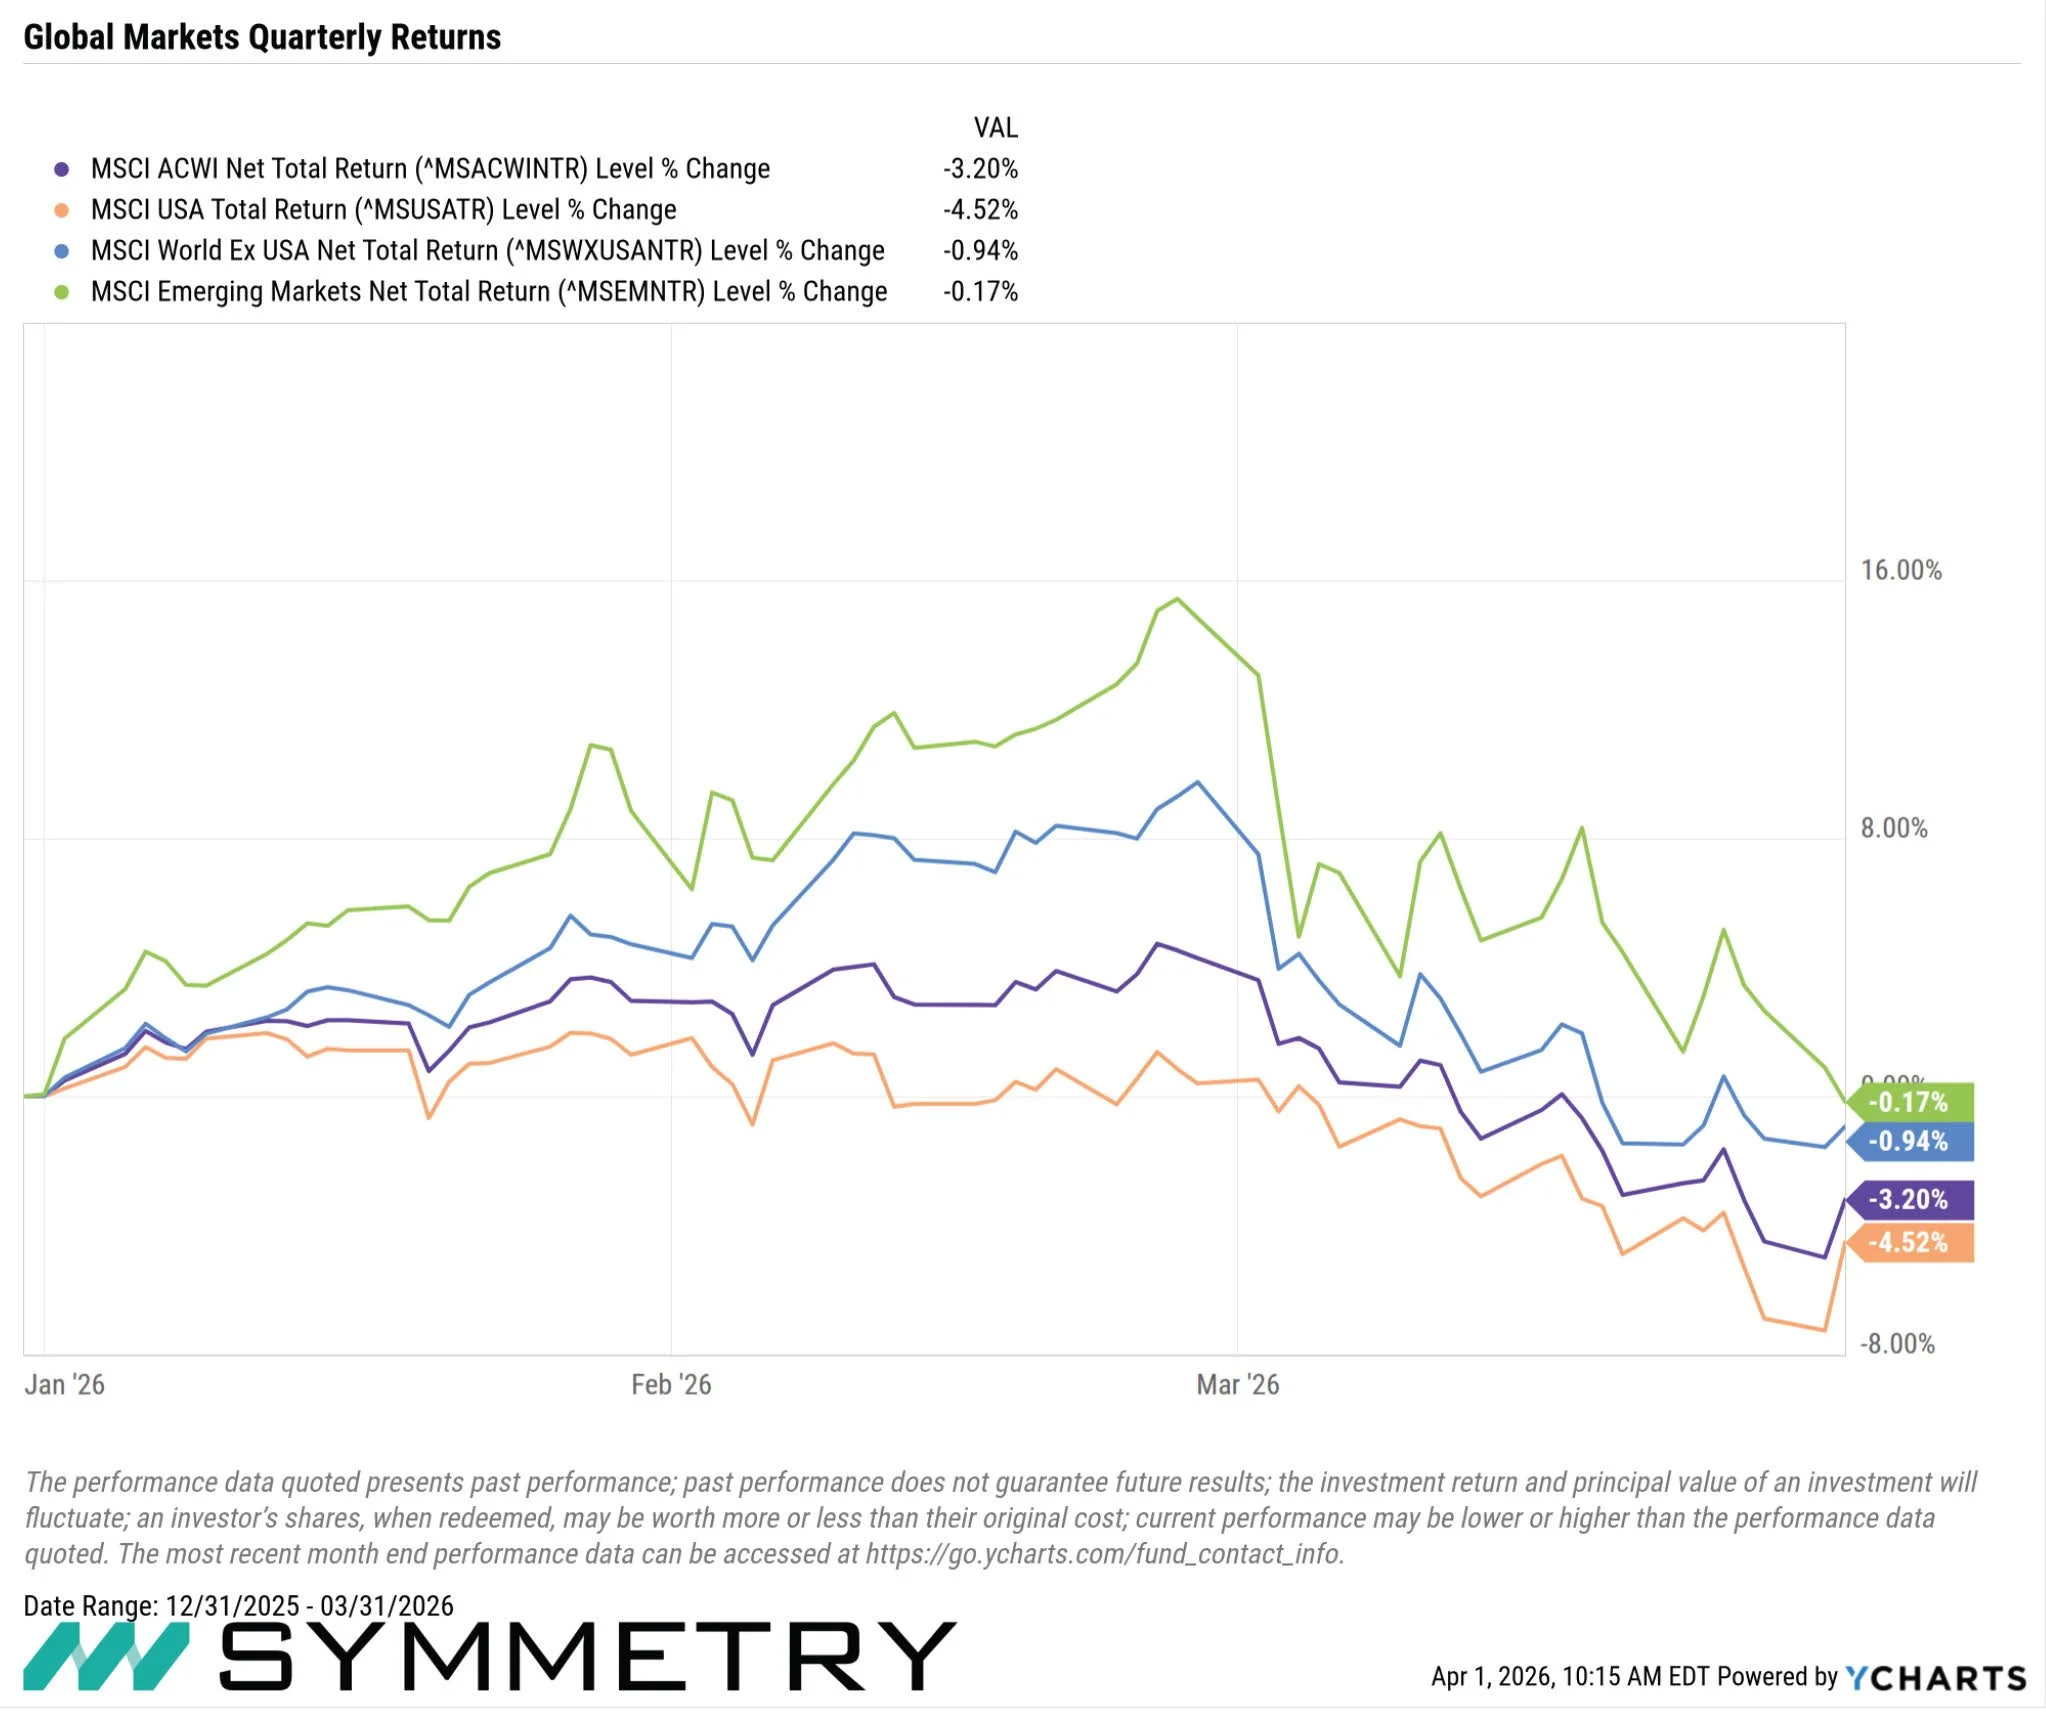
With tighter financial conditions, elevated geopolitical uncertainty, and slower U.S. growth, global markets experienced an incremental decline. However, developed and emerging International markets continued to outperform in Q1. This is consistent with their performance over the last year.
Among U.S. markets, the Federal Reserve held rates steady in both January and March. An emphasis was placed on “sticky” inflation, geopolitical risks, and tariff-related price pressures. Tariffs were challenged by the U.S. court system. They were reinstated via alternative legal pathways. Within U.S. Job openings, hiring, and wage growth, decelerated through the quarter as labor demand cooled. As for the U.S. dollar, global investors have increasingly reallocated toward developed ex-U.S. and emerging markets amid policy risk, valuation gaps, and improved fundamentals abroad.
Note: Performance factors, sectors, and asset classes based on various indices as disclosed in the Markets and Factors Report. Past performance does not guarantee future results.

GLOBAL MARKET OVERVIEW
Global markets fell -3.20% in Q1 2026. Developed and emerging international markets continued to outperform U.S. markets in Q1.
Over the past year, international developed and emerging markets have outperformed significantly, with emerging markets returning over 29% and developed international markets returning nearly 23%.
Global markets declined in Q1 2026 amid tighter financial conditions, elevated geopolitical uncertainty, and slower U.S. growth, while global ex-U.S. and emerging markets continued to outperform
U.S. MARKET OVERVIEW
Fed Policy Pause & “Higher-for-Longer” Repricing:
The Federal Reserve held rates steady in January and March, emphasizing sticky inflation, tariff-related price pressures, and geopolitical risks that constrained near-term easing. Forward guidance became more conditional, pushing out expectations for additional cuts
Tariff Uncertainty and Policy Volatility:
Court challenges and legal uncertainty surrounding emergency tariff authorities curtailed some measures, though the administration reinstated tariffs via alternative legal pathways
Geopolitical Shock:
Escalation in the Iran conflict, in late February, drove oil prices sharply higher, raising inflation expectations and increasing global risk aversion
Slowing U.S. Labor Market Beneath the Surface:
Job openings, hiring, and wage growth decelerated through the quarter, pointing to cooling demand even as headline unemployment remained stable
Capital Rotation Away from “U.S. Crowding”:
After years of U.S. dominance, global investors increasingly reallocated toward developed ex-U.S. and emerging markets amid policy risk, valuation gaps, and improved fundamentals abroad
INTERNATIONAL & EMERGING MARKETS
International equities outperformed U.S. markets in Q1, and on a full-year basis in 2025.
Valuation Advantage and Mean Reversion:
Non-U.S. developed and emerging markets entered 2026 trading at a substantial valuation discount to U.S. equities after years of underperformance, making them more resilient during periods of global risk repricing
Commodity and Energy Exposure:
Rising energy prices linked to Middle East tensions benefited regions and countries with greater commodity and energy exposure, including parts of EM and developed ex-U.S. markets
Reduced Policy and Geopolitical Risk Premium:
Relative to the U.S., where trade policy, tariff legality, and Fed leadership uncertainty weighed on sentiment, many non-U.S. markets were viewed as having more predictable policy backdrops in Q1
Macroeconomics
U.S. LABOR MARKET
U.S. job openings slipped in February and hiring fell to its lowest level since early 2020
Available positions fell to 6.9 million in February, down from 7.2 million in January
The rate of job openings was 4.2% in February, down from 4.4% in January
Unemployment rate ticked up to 4.4% in February from 4.3% in January
Fed Framing: Cooling but Not Cracking
At the January and March FOMC meetings, the Fed cited a labor market that was “cooling but still solid”
Emphasized slower hiring, stable unemployment, and easing wage growth while cautioning that inflation risks (tariffs, energy prices) limited near-term policy flexibility
FEDERAL FUNDS RATE
The Fed held the federal funds target range at 3.50%–3.75% at both its January and March meetings, following multiple cuts in late 2025
Officials emphasized the need to assess cumulative easing effects and monitor inflation risks before proceeding further
While acknowledging slowing job growth, Chair Powell repeated that inflation remained “somewhat elevated,” especially in goods, citing tariffs and energy prices
The Fed made clear it was not on a preset path and would remain data-dependent
GDP & ECONOMIC GROWTH
Fourth-quarter GDP revised down to just 0.7% growth, well below forecasts
Considerable slowdown from the 4.4% gain in the prior period
GDP was hampered by a record-long government shutdown that saw government spending fall -16.7%
Consumer spending slowed in early 2026 as households faced higher energy costs, moderating wage growth, and increased price sensitivity
INFLATION
Inflation readings through the quarter showed headline CPI and core PCE running above the Fed’s 2% target
CPI increased a seasonally adjusted 0.3% for the month, putting the 12- month inflation rate at 2.4%
Limited progress compared to late 2025, but not getting worse
The March Summary of Economic Projections reflected slightly higher 2026 inflation forecasts, acknowledging renewed price pressures
OIL FUTURES & ENERGY MARKETS
Iran-related military escalation sparked a sharp rally in crude oil prices
Markets rapidly repriced geopolitical supply risk
Priced in the possibility of supply disruption affecting roughly 20% of global oil trade that transits the Strait of Hormuz
In March, the U.S. announced a release of 172 million barrels from the Strategic Petroleum Reserve (SPR) over 120 days to combat surging prices
Plans to replace 200 million barrels within a year
While designed to stabilize markets, critics argue this release offers limited relief due to low inventory levels
CONSUMERS
Consumer confidence declined during the quarter, with households citing higher gasoline prices, cost-of-living pressures, and economic uncertainty as primary concerns
The spike in oil prices pushed U.S. gasoline prices above $4 per gallon in several regions for the first time since 2022, disproportionately affecting lower- and middle-income households
Equity market volatility rose meaningfully during the quarter, with the VIX spiking during periods of escalation in the Iran conflict, Fed communications, and tariff headlines.
While volatility did not reach crisis levels, it remained elevated relative to late 2025
Consumer confidence deteriorated faster than spending, creating downside risk for future quarters
Factor Performance
GLOBAL FACTOR PERFORMANCE
Global markets fell in Q1 2026, with the MSCI ACWI returning -3.52%. Global factor performance was mixed.
Value rose 1.31%, outperforming global markets by 4.83%. Higher inflation uncertainty and, elevated rates favored lower-duration, cheaper equities
Small Caps gained 0.68%, outperforming markets by 1.2%. Minimum volatility fell -0.71% and quality fell 3.33%. Momentum fared worse, down -4.30%. Crowded 2025 winners reversed amid rising volatility and rapid macro regime shifts.
U.S. FACTOR PERFORMANCE
U.S. factors demonstrated mixed performance in Q1 2026. Small-cap securities performed best, gaining 2.29%, outperforming U.S. markets by 6.81%, benefiting from reduced mega-cap concentration.
Value rose 0.80%, outperforming U.S. markets by 5.32%. Minimum volatility fell -1.56% and quality lost -3.91%. Momentum fared worst, losing -4.62% and underperforming sharply as crowded mega-cap and growth-oriented trades reversed in a volatile macro environment.
INTERNATIONAL FACTOR PERFORMANCE
International developed factors demonstrated mixed performance in Q1 2026. Minimum volatility rose 2.46%, outperforming international markets significantly by 3.4%. Value increased 1.67%, small-cap securities lost -0.98%, momentum fell -2.72% and quality declined -3.71%.
EMERGING MARKETS FACTOR PERFORMANCE
Emerging market factors demonstrated mixed performance in Q1 2026. Value performed best, gaining 0.65%, outperforming markets by 82 bps. Quality fell 0.19%, followed by momentum, losing -0.49%. Small-caps lost 1.09% and minimum volatility slightly declined -2.67%.
Bond Market Overview
BOND MARKET INDICES
Fixed income markets were pressured in Q1 2026 by persistent inflation, a cautious Federal Reserve, higher energy prices, and geopolitical uncertainty. Returns varied meaningfully across regions, currencies, and credit quality.
Global bonds faced currency and duration headwinds. Diverging central-bank paths and FX volatility weighed on non-U.S. bond markets, particularly where local currencies weakened against the dollar earlier in the quarter. EM debt faced a challenging backdrop from higher global yields, geopolitical risk, and intermittent dollar strength.
Corporate fundamentals remained generally sound, but higher yields and modest spread widening led to slightly negative total returns across credit sectors.
With cuts delayed and inflation risks elevated, curve movements favored shorter-duration exposure over long-duration bonds
U.S. TREASURY YIELD CURVE
Toward the end of Q1, the yield curve showed early signs of steepening. Yields at the front end of the curve remained high and relatively stable. The Federal Reserve held the fed funds rate steady and emphasized a cautious, data-dependent approach.
Longer-dated Treasury yields were more volatile during the quarter and rose at points as inflation expectations increased.
U.S. CORPORATES
The U.S. corporate yield curve in Q1v2026 remained relatively flat and elevated. High front-end and intermediate Treasury yields kept corporate yields elevated across the curve. Longer-dated investment-grade corporates experienced mild spread widening. Investors required additional compensation for duration risk, inflation uncertainty, and geopolitical and policy volatility.
Spreads could widen with geopolitical tension, slowing of growth, or inflation acceleration.